
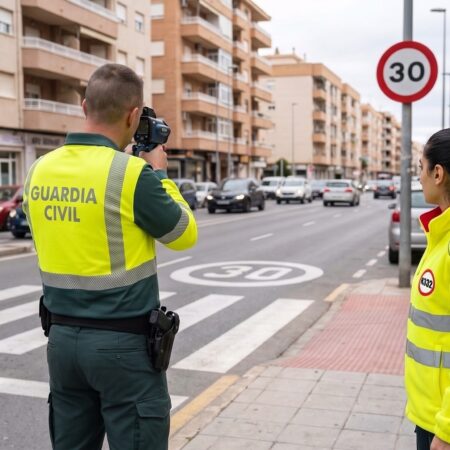

The transition from a 50 km/h to a 30 km/h urban speed limit is often perceived by motorists as an arbitrary regulatory constraint. From the perspective of physical dynamics and trauma biomechanics, however, the differential represents a structural dividing line between human biological tolerance and fatal kinetic disruption.
The human frame evolved to withstand forces generated at biological locomotion speeds: running impacts between 15 km/h and 25 km/h. When subjected to the blunt force trauma of an automotive impact, the human body functions as an unconstrained physical entity absorbing energy that escalates non-linearly with vehicle velocity.
1. The Kinetic Energy Differential
The fundamental determinant of trauma severity in collision physics is kinetic energy.
Because velocity is squared, small increments in operational travel speed yield disproportionate increases in energy release.
For a standard passenger vehicle with an average mass of 1,500 kilograms:
A 67 per cent increase in forward velocity generates a 178 per cent increase in kinetic energy (a ratio of 2.78 to 1). At 50 km/h, the vehicle carries nearly three times the destructive energy of the same vehicle at 30 km/h. In any collision with an unprotected pedestrian, a substantial portion of this differential must be dissipated through the vehicle’s deformable structures and, critically, through the biological deformation of human tissue and bone.
2. Stopping Distance Mechanics and the Residual Velocity Trap
The second critical physical factor is stopping distance, which comprises perception-reaction distance and physical braking distance.
Assuming an alert driver with a perception-reaction time (PRT) of 1.0 second on dry, level asphalt with a nominal deceleration rate of $a = 6.86\text{ m/s}^2$ ($0.7g$):
| Parameter | At 30 km/h (8.33 m/s) | At 50 km/h (13.89 m/s) | Relative Change |
| Reaction Distance | 8.33 metres | 13.89 metres | +67% |
| Braking Distance | 5.06 metres | 14.05 metres | +178% |
| Total Stopping Distance | 13.39 metres | 27.94 metres | +109% (More than double) |
Spatial Stopping Comparison:

30 km/h:  |-- Reaction: 8.33m --|-- Braking: 5.06m --| (Stopped at 13.39m)
50 km/h:  |------ Reaction: 13.89m ------|------ Braking: 14.05m ------| (Stopped at 27.94m)
                                         ^
              Pedestrian struck here by the 50 km/h vehicle before braking even commences
The Residual Velocity Trap
The operational consequence of this divergence is catastrophic. If an unexpected pedestrian hazard emerges 13.4 metres ahead:
- The vehicle travelling at 30 km/h comes to a complete, controlled halt immediately in front of the pedestrian. No impact occurs.
- The vehicle travelling at 50 km/h requires 13.89 metres merely for the driver to process the visual stimulus and depress the brake pedal.
Consequently, at 13.39 metres, the 50 km/h vehicle strikes the pedestrian at its full, unattenuated entry speed of 50 km/h. Even if emergency braking begins slightly earlier, the deceleration curve means residual impact speeds remain elevated in the final metres of travel.
3. The Biomechanical Trauma Cascade
When a pedestrian is struck by the blunt front profile of a motor vehicle, the collision does not constitute a single event. It unfolds across a four-phase biomechanical cascade occurring within 200 to 400 milliseconds.
Phase 1: Bumper Contact        Phase 2: Pelvic Rotation       Phase 3: Head / Windscreen     Phase 4: Ground Ejection
(Tibia / Fibula shearing)     (Femur & pelvic ring load)     (Severe TBI / Skull fracture)  (Blunt secondary trauma)
        [===]                         [===]                          [===]
         | |                           \ \                            \ \
        /   \                          /   \                           \ \ ===>
Phase 1: Primary Bumper Contact (Lower Extremities)
- Kinematics: The bumper strikes the lower leg below the anatomical centre of gravity (approximately 0.55 of human standing height).
- 30 km/h: Shear stresses on the tibia and fibula generally remain below the threshold of compound comminuted fractures. Soft tissue and collateral knee ligament tears occur, but structural skeletal integrity is frequently preserved.
- 50 km/h: The rapid acceleration transferred to the lower leg exceeds the dynamic ultimate tensile strength of cortical bone. Transverse or comminuted fractures of the tibia and fibula are standard, frequently accompanied by total dislocation and rupture of the knee joint complex.
Phase 2: Bonnet Leading-Edge Contact (Pelvis and Femur)
- Kinematics: The pedestrian’s legs are swept forward, causing the torso to rotate rapidly towards the vehicle bonnet.
- 30 km/h: The pelvic ring absorbs a lateral compression load that, in younger adults, falls within physiological elastic limits.
- 50 km/h: The pelvic ring experiences severe direct impact with the bonnet leading edge, resulting in open pelvic ring disruptions, extensive internal vascular lacerations (specifically of the internal iliac arterial branches), and acute hemorrhagic shock.
Phase 3: Secondary Upper Body and Head Impact (Bonnet, Cowl, and Windscreen)
- Kinematics: As rotation continues, the pedestrian’s torso wraps over the bonnet, and the cranium strikes the bonnet surface, the wiper cowl, or the structural A-pillars.
- 30 km/h: The Head Injury Criterion (HIC) typically registers below 650 on compliant bonnet surfaces. The relative impact velocity between head and bonnet is sufficiently low that serious diffuse axonal injury (DAI) and depressed skull fractures are rare.
- 50 km/h: Rotational trajectory flings the head into the structural perimeter: the reinforced windscreen cowl or the A-pillars. The HIC routinely exceeds 1,500 to 2,000 (the critical threshold for life-threatening cranial trauma is 1,000). The consequence is acute subdural hematoma, basal skull fracture, severe coup-contrecoup parenchymal contusions, and fatal traumatic brain injury (TBI).
Phase 4: Tertiary Impact (Ground Ejection and Secondary Trauma)
- Kinematics: Following deceleration or complete braking of the vehicle, the pedestrian is projected off the vehicle and impacts the road surface.
- 30 km/h: Projection distance is brief (typically 2 to 6 metres), and secondary ground impact energy is attenuated.
- 50 km/h: The pedestrian is vaulted into the air and projected between 12 and 22 metres forward or over the vehicle roof, sustaining severe secondary blunt-force polytrauma, rib cage crush injuries, hemothorax, and spinal column fractures upon contact with the asphalt or kerb.
4. Injury Severity and Fatality Probability Curves
Empirical accidentology studies (notably by Rosén and Sander, the Swedish Transport Administration, and the World Health Organization) demonstrate that the injury severity curve for pedestrians is sigmoidal (logistic), exhibiting an acute upward inflection point precisely between 30 km/h and 50 km/h.
Fatality Probability Curve:
100% |                                               . - - -
 80% |                                           . '
 60% |                                       . '
 40% |                                   . ' (Approx. 40-50% at 50 km/h)
 20% |                           . '
  0% | _ _ _ _ _ . . . . . ' ' (Under 10% at 30 km/h)
      ------------------------------------------------------
      0        10        20        30        40        50 km/h
- At 30 km/h: Fatality probability is constrained to approximately 5 to 10 per cent for healthy adult pedestrians. The Maximum Abbreviated Injury Scale (MAIS) profile concentrates around MAIS 1 to MAIS 2 (minor to moderate injuries).
- At 50 km/h: Fatality probability escalates dramatically to between 40 and 50 per cent. The probability of sustaining MAIS 3+ (severe, life-threatening injury) or fatal trauma exceeds 70 per cent.
- Vulnerable Demographic Amplification: For elderly pedestrians (aged 65 and above) and young children, whose biological fragility and bone mineral density are lower, an impact at 50 km/h carries an effective fatality rate exceeding 70 to 80 per cent. Conversely, at 30 km/h, survivability remains high across all demographic cohorts.
5. Systemic Policy Implications
The physical realities of pedestrian crash mechanics clarify why international road safety bodies (including ROADPOL, the European Transport Safety Council, and national agencies like Spain’s DGT) treat 30 km/h limits on single-carriageway urban streets as an absolute safety requirement rather than a discretionary target:
- Elimination of Human Fragility Surpluses: Modern vehicle crash structures are heavily optimised to protect internal occupants at 50 km/h to 70 km/h via crumple zones, pre-tensioners, and curtain airbags. No equivalent biomechanical shielding exists for the human exterior. Lowering vehicle kinetic energy to match human physical tolerances is the sole systemic solution.
- Crash Avoidance Buffer: The spatial savings of lower speeds mean that in high-density urban environments, an alert driver at 30 km/h avoids the physical collision altogether, converting a potential fatal trauma statistic into a simple near-miss.
- Infrastructure Alignment: Street design that communicates 30 km/h visually (through lane narrowing, raised pedestrian crossings, and chicanes) reinforces the psychological cues required for natural compliance, eliminating reliance on driver goodwill alone.
The differential between 30 km/h and 50 km/h is not a marginal difference of 20 km/h; it is the fundamental physics threshold separating treatable orthopedic injury from fatal internal trauma.

Other Articles
Did We Close the Driving Learning Loop Too Soon?